Top 12 Market Research Data Analysis Tools to Work Smarter in 2026
Discover the top 12 market research data analysis tools to automate tasks and work smarter. A detailed guide for junior analysts and marketing specialists.

You know the fundamentals of market research. The real challenge isn’t just executing the tasks—it's scaling your impact and finding smarter ways to work. Manually cleaning CSVs, enriching CRM data, or screening deal lists are critical but time-consuming processes that create bottlenecks, pulling you away from high-level strategic analysis. As AI and data platforms evolve, relying solely on traditional, manual methods means falling behind.
This guide is for professionals like you: junior analysts, demand-generation specialists, and VC analysts who are already proficient but are looking for the right tech to amplify your efforts. We’ll skip the basic definitions and jump straight into a curated list of 12 powerful market research data analysis tools. The focus is on practical application—how these platforms can automate your repeatable tasks and fit into the workflows you already use.
In this comprehensive roundup, we’ll explore what each tool does best, its ideal use cases (from taxonomy extraction to competitive intelligence), and its key features. For each platform, you'll find an honest assessment of its pros and cons, transparent pricing information, and potential integrations. We provide screenshots and direct links to help you evaluate which solution best fits your specific needs, whether you rely on batch CSV processing, API-driven workflows, or sophisticated statistical analysis. This is your playbook for finding the tools that will help you deliver faster, more meaningful insights.
1. Row Sherpa
Row Sherpa is a purpose-built platform designed to eliminate the repetitive, manual work of analyzing large CSV datasets. It operates on a simple yet effective principle: apply a single, consistent AI prompt to thousands of rows asynchronously. This makes it an exceptional tool for teams in sales ops, venture capital, and market research who need to classify, enrich, or score data at scale without dedicating engineering resources or writing custom scripts.
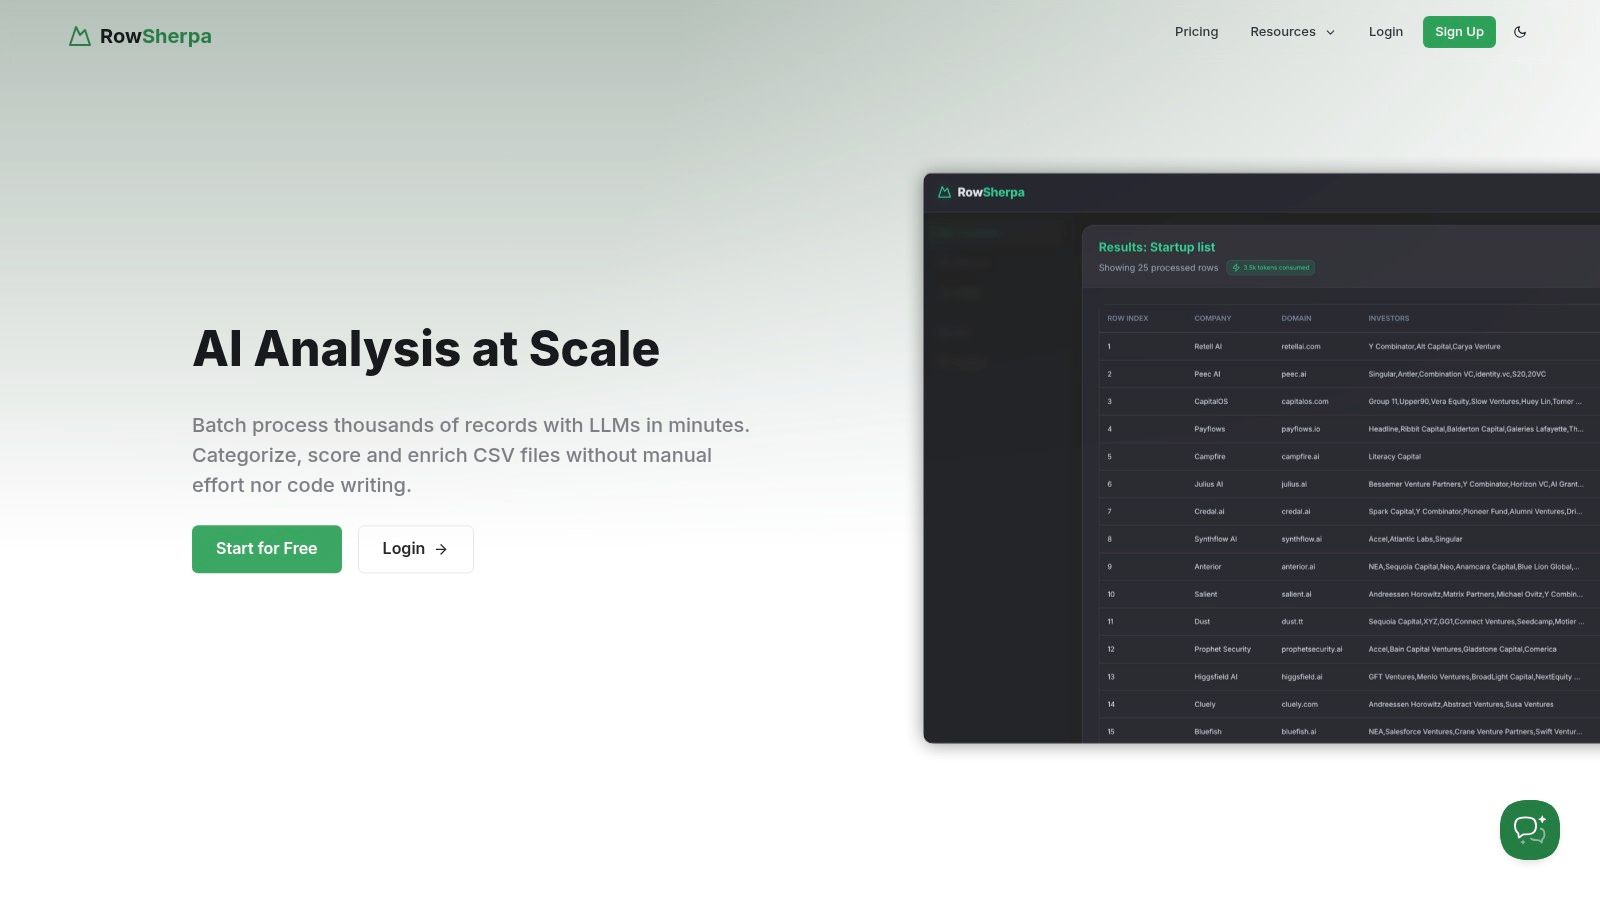
What sets Row Sherpa apart is its focus on producing predictable, structured output. Unlike general-purpose chat LLMs that can yield inconsistent results when processing large files, Row Sherpa ensures every run returns a validated JSON or CSV file. This reliability is critical for downstream automation, ensuring data can be ingested directly into CRMs, analytics platforms, or other business systems without manual cleanup.
Key Features & Use Cases
Row Sherpa excels at specific, high-impact tasks that are traditionally time-consuming for analysts. By leveraging its unique architecture, it transforms complex data processing into a manageable, low-friction workflow.
- Batch Processing at Scale: Asynchronously run AI jobs on thousands of rows in minutes. Launch a task and get notified when your structured results are ready, avoiding the workflow blockage common with manual or scripted approaches.
- Structured & Validated Outputs: Define your desired output fields upfront to receive clean, predictable JSON or CSV files. This structural integrity makes Row Sherpa ideal for feeding data into automated pipelines.
- Optional Web Enrichment: For tasks requiring up-to-date context, you can enable live web search on a per-row basis. This feature significantly improves the accuracy of classification, entity extraction, and sentiment analysis by augmenting your source data with fresh information.
- Dual UI & API Access: While its visual interface makes it accessible to non-technical users, the entire platform is built on a public API. This allows for full programmatic control, enabling teams to integrate Row Sherpa directly into their existing data workflows.
Practical Application: A market research team can upload a CSV of thousands of open-ended survey responses. Using a single prompt, they can extract key themes, score sentiment, and categorize feedback according to a predefined taxonomy, completing in minutes what would otherwise take days of manual analysis. For a deeper dive into these techniques, you can explore guides on using AI for data analysis.
Pricing and Access
Row Sherpa offers a transparent, usage-based pricing model designed to scale with your needs.
| Plan | Price/Month | Rows | Web Search Rows | Key Limits |
|---|---|---|---|---|
| Free | $0 | 100 | 10 | Up to 100 tokens/prompt; 5 output fields |
| Starter | $49 | 5,000 | 1,000 | Up to 200 tokens/prompt; 5 output fields |
| Premium | $149 | 15,000 | 2,500 | Up to 400 tokens/row; 10 output fields |
| Pro | $449 | 30,000 | 5,000 | Up to 1,000 tokens/row; 15 output fields |
Pros & Cons
- Pros:
- Fast, asynchronous batch workflows for processing thousands of CSV rows.
- Predictable, validated JSON/CSV outputs that make automation reliable.
- Optional live web search to enrich inputs and improve classification.
- Public API enables fully programmatic workflows.
- Transparent, usage-based pricing with a functional free tier.
- Cons:
- Plan limits on rows, tokens, and output fields may require upgrades for larger projects.
- The SaaS-only model with 30-day file retention may not suit teams with strict data compliance or long-term retention needs.
Website: https://rowsherpa.com
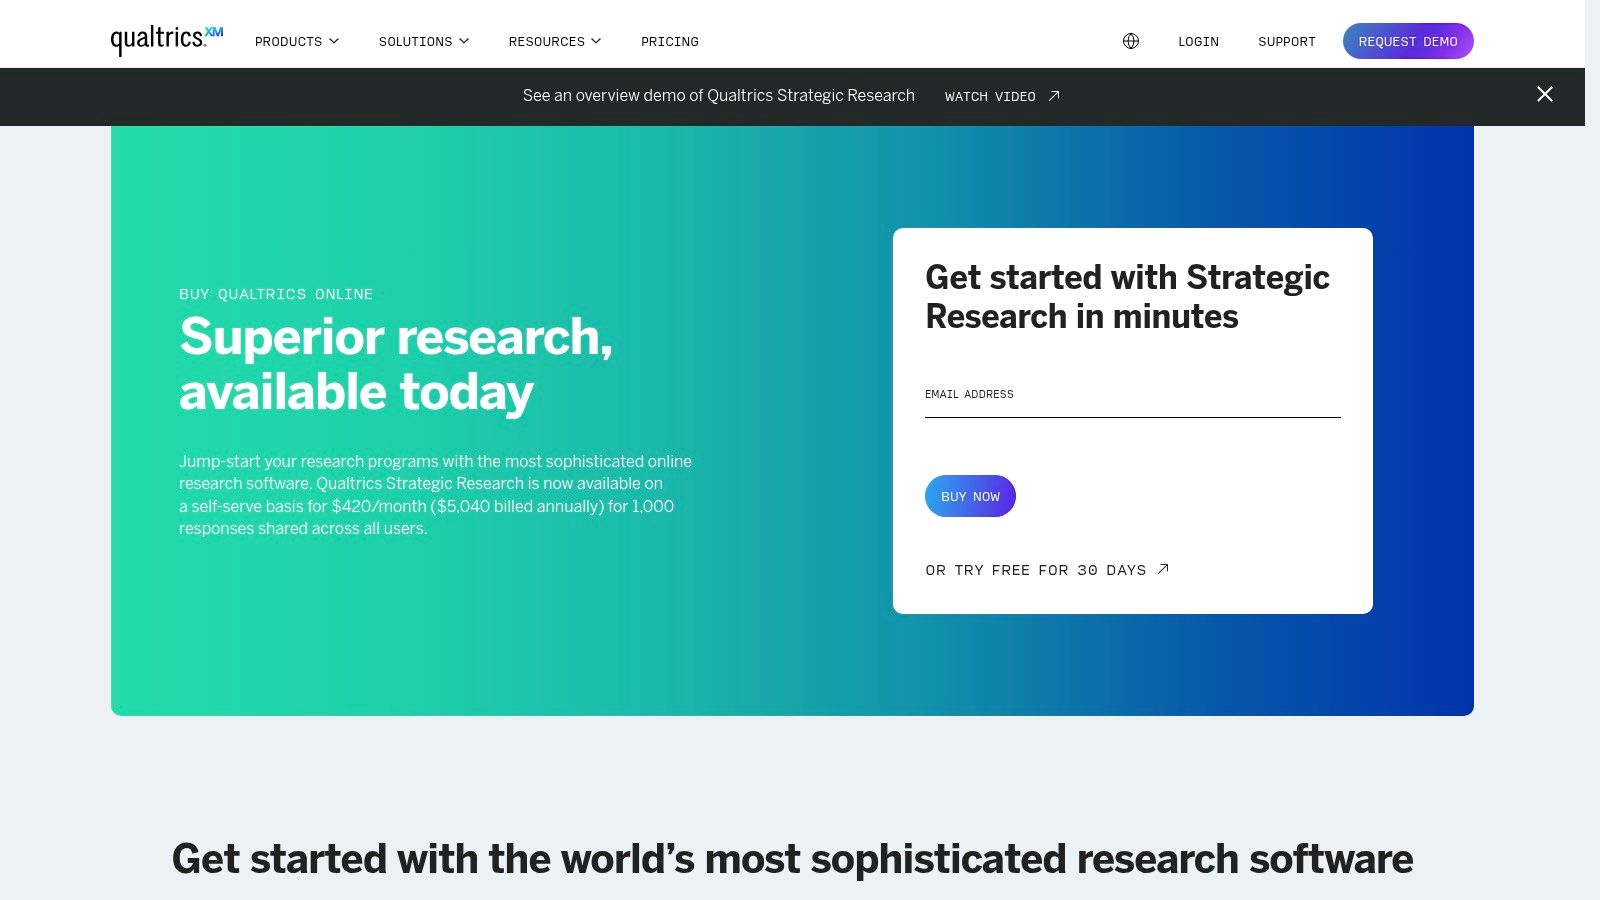
2. Qualtrics — Strategic Research
Qualtrics is an enterprise-grade platform that moves beyond simple surveys into a full-fledged experience management (XM) and market research ecosystem. For insights teams needing a single source of truth, it centralizes survey design, panel management, advanced analytics, and reporting. Its power lies in providing a governed, multi-user environment where complex research projects can be managed from start to finish with robust security and collaboration features.
Unlike simpler survey tools, Qualtrics is built for strategic initiatives, enabling sophisticated logic, branching, and statistical analysis directly within the platform. This makes it one of the more comprehensive market research data analysis tools available for large-scale studies. The platform’s ability to integrate across its own Customer Experience (CX) and Employee Experience (EX) modules allows teams to connect disparate data points for a holistic view of the market landscape. This unified approach is essential for implementing the kind of deep analysis discussed in our market research best practices guide.
Key Features and Use Cases
- Ideal Use Case: Corporate insights teams conducting brand tracking, product concept testing, or customer segmentation studies that require advanced survey logic and integrated analytics.
- Self-Serve vs. Enterprise: Offers a free tier for basic surveys and a self-serve Strategic Research plan, but advanced modules and full platform capabilities often require engaging with their sales team.
- Centralized Governance: Provides robust administrative controls for managing user access, ensuring data quality and compliance across large, distributed teams.
| Pros | Cons |
|---|---|
| All-in-one platform for collection, analysis, and reporting | Pricing is significantly higher than SMB-focused tools |
| Strong enterprise security and data privacy features | Full feature set requires sales-led engagement |
| Extensive marketplace for integrations and extensions | Can be overly complex for simple survey needs |
Website: https://www.qualtrics.com/buy-online/
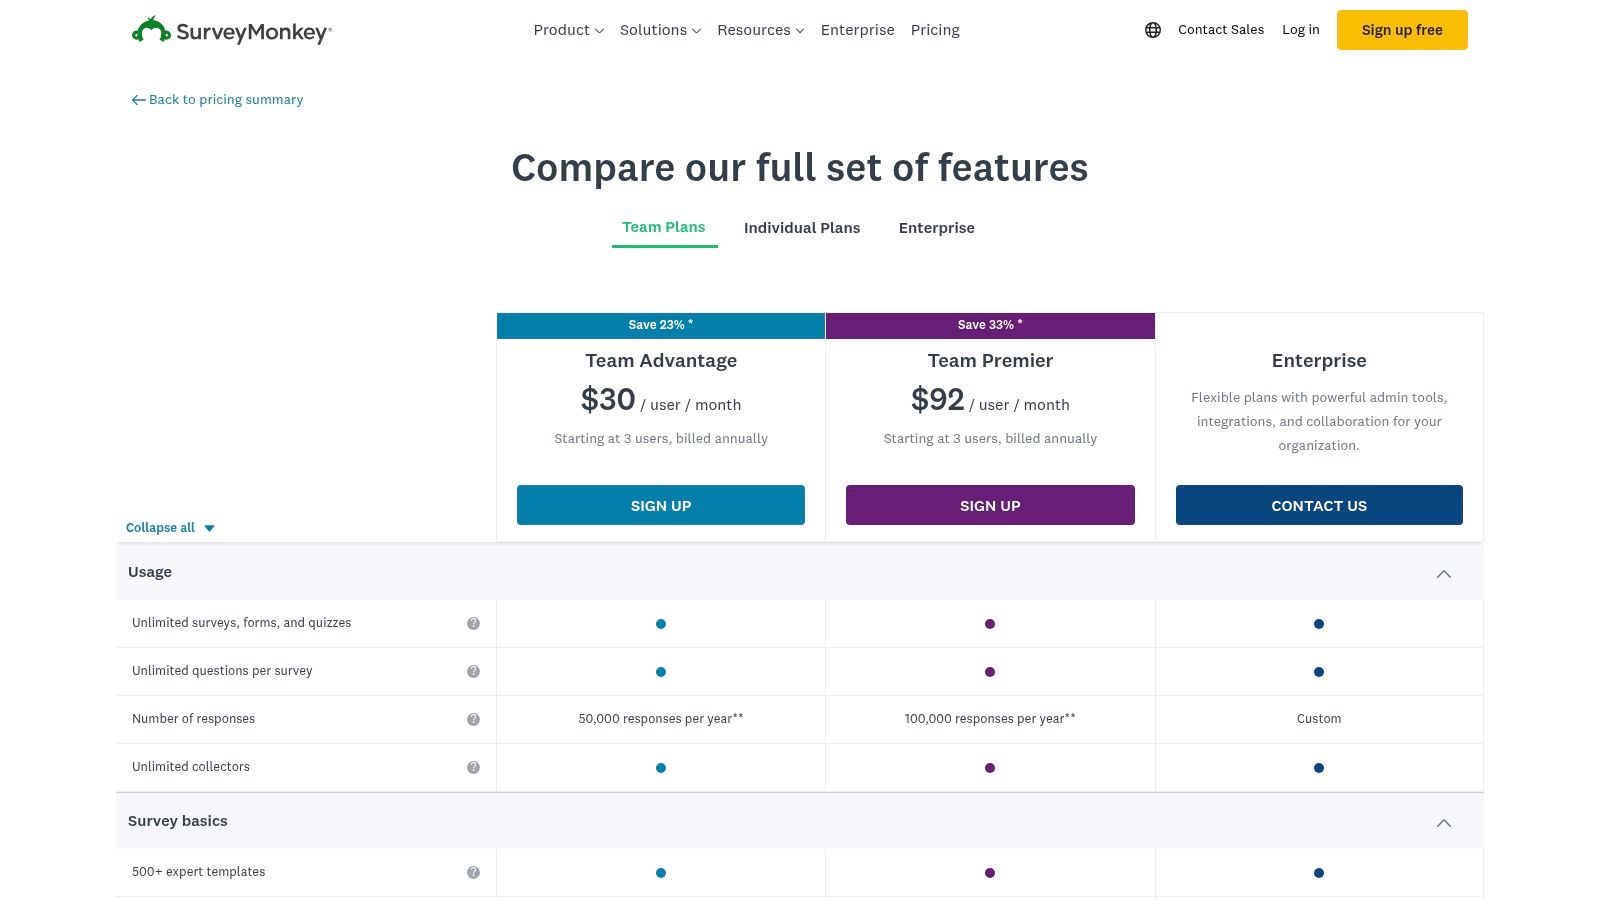
3. SurveyMonkey (Momentive) - Rapid-Turnaround Surveys
SurveyMonkey, a Momentive company, is one of the most widely recognized and accessible platforms for creating and distributing surveys. Its core strength lies in its simplicity and speed, making it an excellent choice for teams that need to quickly gather market feedback, test ad concepts, or run simple customer satisfaction polls. The platform provides a user-friendly interface with numerous templates and best-practice guides, enabling even junior analysts to launch effective research projects with minimal ramp-up time.
Unlike enterprise-focused ecosystems, SurveyMonkey prioritizes fast time-to-value. Its built-in analytics dashboard allows for immediate data review, including crosstabs and filters, which is sufficient for many straightforward market research data analysis tasks. For teams needing to move quickly from question to insight, its collaborative features, like shared asset libraries and real-time commenting, streamline the workflow from survey design to final report without requiring extensive training.
Key Features and Use Cases
- Ideal Use Case: Marketing and growth teams needing fast, actionable feedback on campaigns, product features, or customer sentiment without the complexity of a full research suite.
- Self-Serve vs. Enterprise: Primarily a self-serve model with clear pricing tiers (Team Advantage, Team Premier) available online. An Enterprise plan offers advanced security, compliance (HIPAA-eligible features), and integrations.
- Collaboration-Focused: Team plans are built around shared libraries and commenting, allowing multiple stakeholders to contribute to survey design and analysis efficiently.
| Pros | Cons |
|---|---|
| Extremely fast time-to-value for junior analysts and teams | Some advanced analytics require higher-tier plans or data exports |
| Widely adopted with many templates and best-practice guidance | Per-response overage fees can add up on paid plans |
| Strong collaboration features for team-based projects | Less suited for highly complex, multi-stage research projects |
Website: https://www.surveymonkey.com/pricing/details/
4. Alchemer (formerly SurveyGizmo)
Alchemer, formerly known as SurveyGizmo, offers a flexible survey and feedback platform that hits a sweet spot between basic tools and complex enterprise systems. It is particularly attractive to smaller research teams and SMBs who need more control and sophisticated logic, like advanced piping and branching, without committing to enterprise-level pricing. The platform is designed for agility, allowing users to quickly build, deploy, and analyze research projects with a practical, hands-on approach.
Unlike many competitors that gate essential features behind enterprise contracts, Alchemer provides robust functionality in its self-serve tiers, making it one of the more accessible market research data analysis tools for teams needing power on a budget. Its reputation for strong customer support, including phone access, provides a reliable safety net for junior analysts or small teams managing critical projects without extensive internal resources. The platform's clear pricing and high response allowances on paid plans simplify budget planning and project scope.
Key Features and Use Cases
- Ideal Use Case: Small to mid-sized market research teams conducting customer satisfaction studies, product feedback surveys, or ad-hoc research that requires complex logic and custom reporting.
- Self-Serve vs. Enterprise: Offers clear individual and small team plans (1–3 users) that can be purchased directly online. The Business Platform provides API access, advanced integrations, and HIPAA-supporting options for larger operational needs.
- Flexible Survey Logic: Powerful question piping, show/hide logic, and custom scripting allow for the creation of highly dynamic and personalized survey experiences, improving data quality.
| Pros | Cons |
|---|---|
| Clear, transparent pricing with monthly or annual options | API and advanced security are limited to higher-cost Business tiers |
| Strong reputation for helpful and accessible customer support | The trial period may feel short for evaluating complex projects |
| Generous response allowances on paid plans | Can lack the all-in-one governance of full enterprise platforms |
Website: https://www.alchemer.com/plans-pricing/
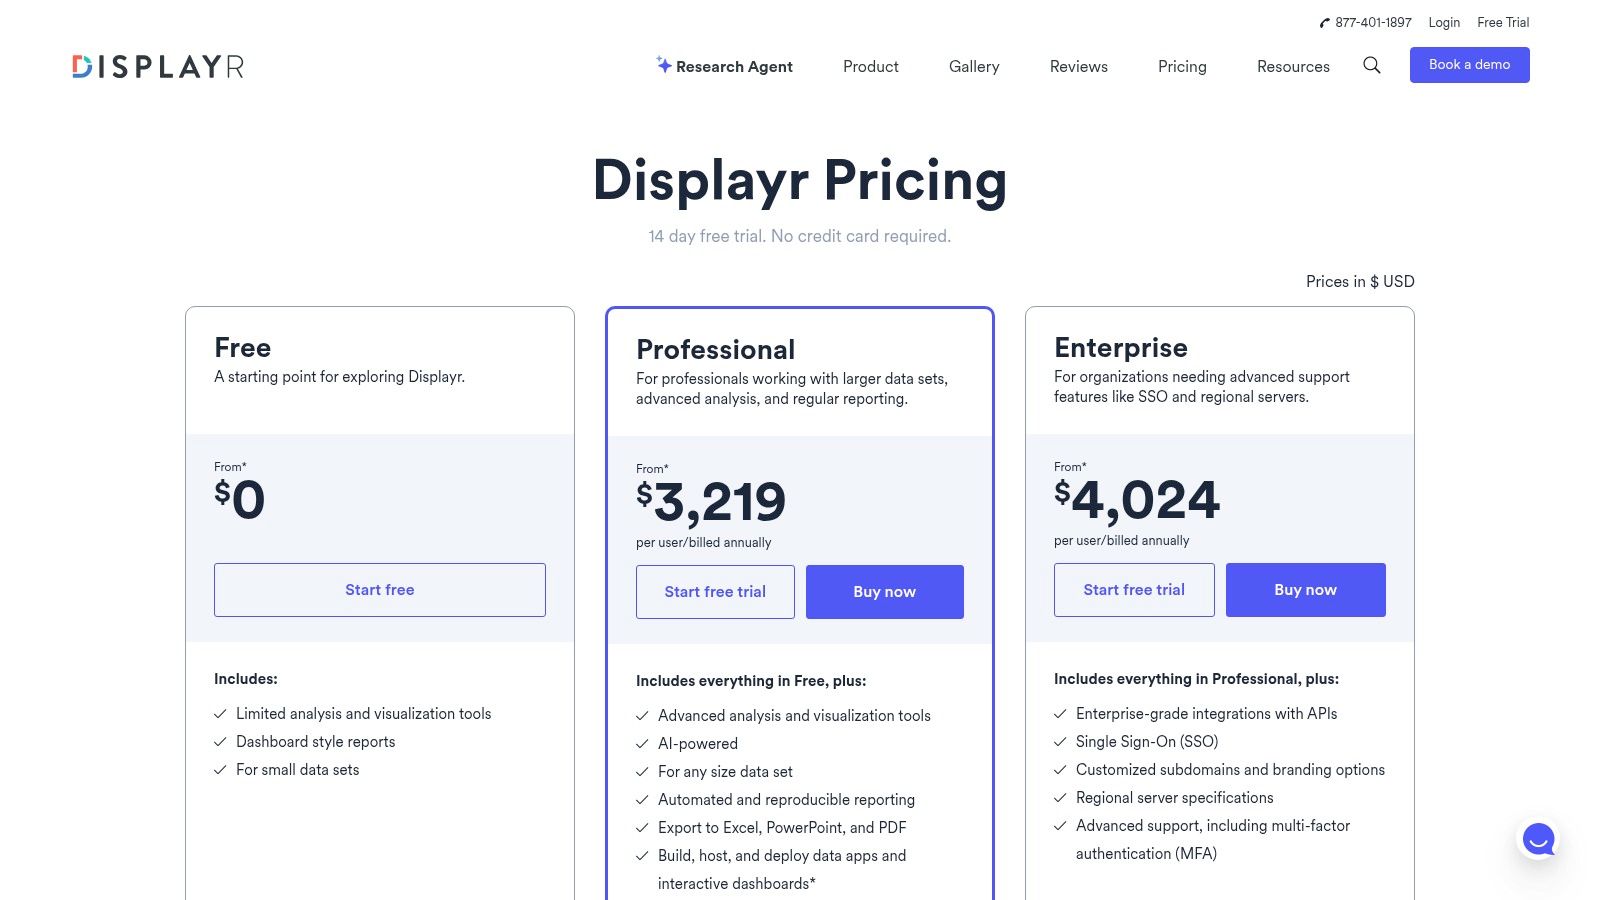
5. Displayr — Analysis, dashboards, and reporting
Displayr is an end-to-end platform designed specifically for survey data analysis and automated reporting, aiming to consolidate the traditional toolchain of crosstabs, statistical software, and dashboarding into one environment. For market research and insights teams struggling to standardize their workflow, it provides a unified space to move from raw data to a final PowerPoint or interactive dashboard. This focus on a streamlined, reproducible process makes it a powerful choice for analysts looking to improve efficiency.
Unlike general-purpose BI tools, Displayr understands the unique structure and needs of survey data, with built-in statistical tests and visualization types tailored for market research. The platform's ability to automate updates from data sources directly into reports and dashboards saves analysts significant time on repeatable tasks. By integrating advanced analysis with powerful, automated exports to common formats like PowerPoint and Excel, Displayr stands out as one of the more specialized market research data analysis tools for teams prioritizing reporting speed and consistency.
Key Features and Use Cases
- Ideal Use Case: Market research teams that frequently run tracking studies or need to deliver standardized reports (e.g., brand health, campaign effectiveness) to stakeholders in PowerPoint or Excel.
- AI-Powered Analysis: Includes AI features with significant token allocations to assist with summarizing open-ended responses, generating commentary, and accelerating the analysis process.
- Reproducible Reporting: Projects can be set up as templates, allowing new waves of data to automatically populate and update existing dashboards and reports, ensuring consistency.
| Pros | Cons |
|---|---|
| Purpose-built for survey data, reducing tool sprawl | Annual billing only, and professional pricing is premium |
| Strong automation and export pipeline to PowerPoint/Excel | Additional server time and AI packages can increase the cost |
| Simplifies complex statistical analysis for researchers | May have a steeper learning curve than basic survey platforms |
Website: https://www.displayr.com/pricing/
6. Crunch.io — Specialized Survey Data Analysis
Crunch.io is a cloud-native platform engineered specifically for analyzing survey data at scale. It excels in environments where speed and collaboration are critical, such as brand tracking studies or multi-wave research projects. The platform is designed to handle the unique structures of survey data, like categorical variables, arrays, and multi-select questions, allowing analysts to rapidly slice, dice, filter, and weight large datasets without the cumbersome processing required by general-purpose BI tools.
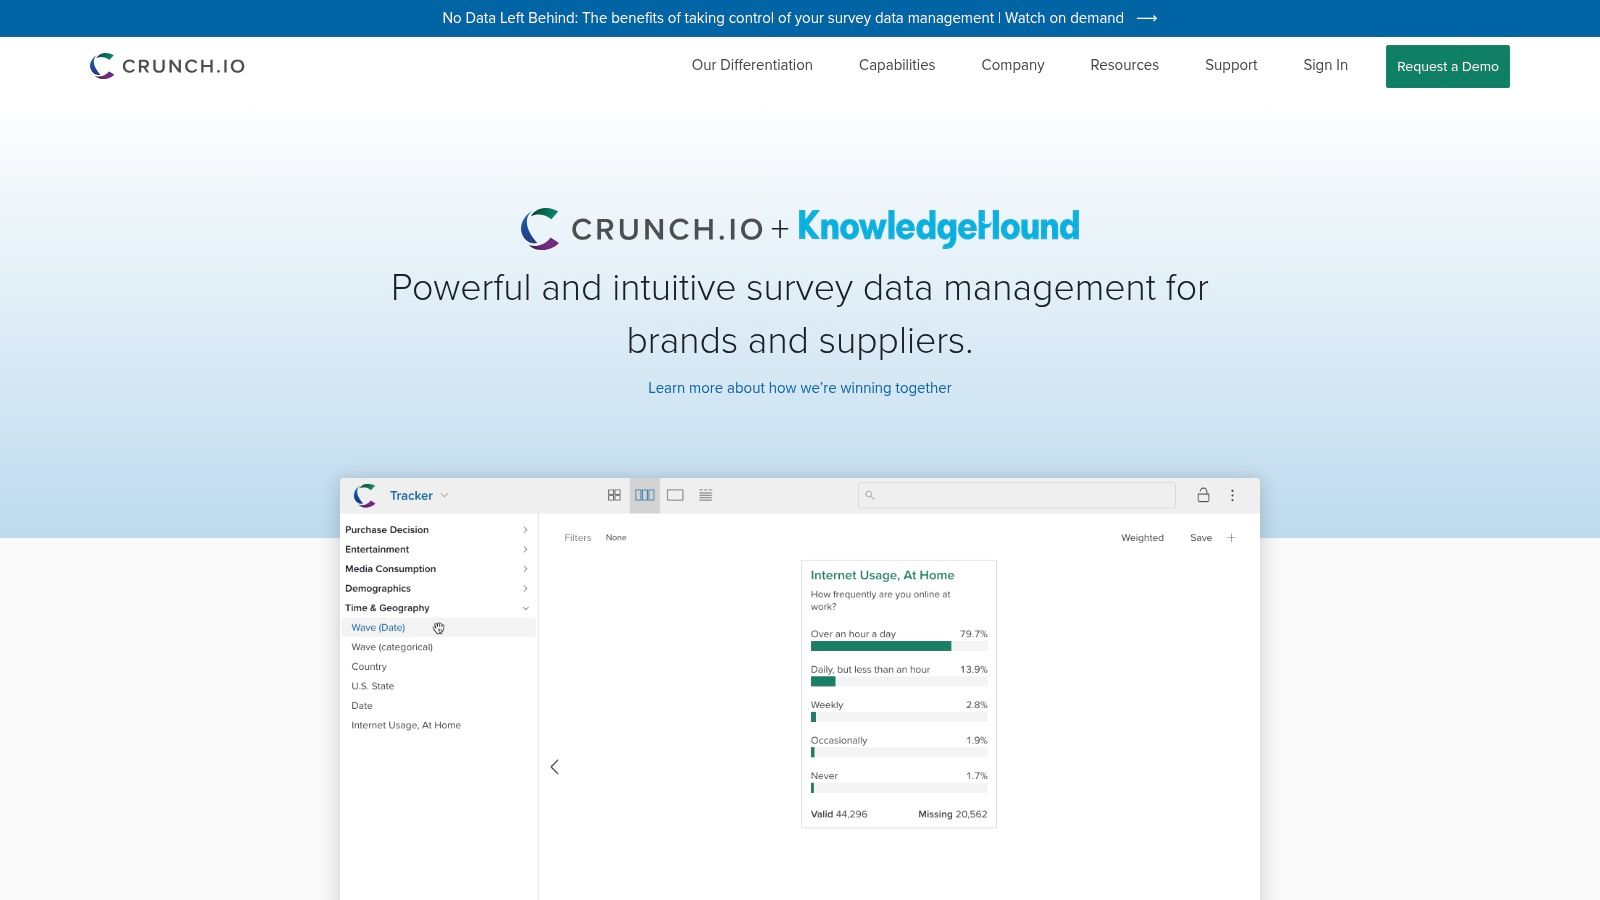
What sets Crunch.io apart is its sub-second response time for complex crosstabs and filters, even on datasets with millions of respondents. This interactive speed empowers teams to explore data fluidly and share findings through live, client-ready dashboards. As one of the more focused market research data analysis tools, it streamlines the workflow from data ingestion (via API connections to platforms like SurveyMonkey) to final report export, making it a powerful choice for teams that live and breathe survey analysis and need to deliver insights quickly.
Key Features and Use Cases
- Ideal Use Case: Market research agencies or corporate insights teams managing large, ongoing tracking studies that require fast, collaborative analysis and dashboarding.
- Self-Serve vs. Enterprise: Primarily an enterprise solution sold through a direct sales process. It is designed for team-based workflows rather than individual, self-serve use.
- Survey-First Architecture: Its data model is built from the ground up to understand survey constructs, enabling intuitive drag-and-drop creation of derived variables and complex tables.
| Pros | Cons |
|---|---|
| Extremely fast performance on large survey datasets | Pricing is not publicly listed and requires sales contact |
| Creates interactive, shareable client dashboards easily | Highly specialized for survey data, not general-purpose BI |
| Native handling of weighting, multi-selects, and arrays | Steeper learning curve for those new to crosstab analysis |
Website: https://crunch.io/
7. IBM SPSS Statistics — Advanced Statistical Analysis
IBM SPSS Statistics is a classic statistical workhorse, long trusted by academic and corporate researchers for deep, method-heavy quantitative analysis. It excels at moving beyond basic descriptive statistics into predictive modeling, enabling users to perform complex procedures like regressions, factor analysis, and conjoint analysis with a high degree of control and accuracy. For analysts needing to produce defensible, publication-grade findings, SPSS provides a robust, GUI-driven environment for data manipulation and statistical testing.
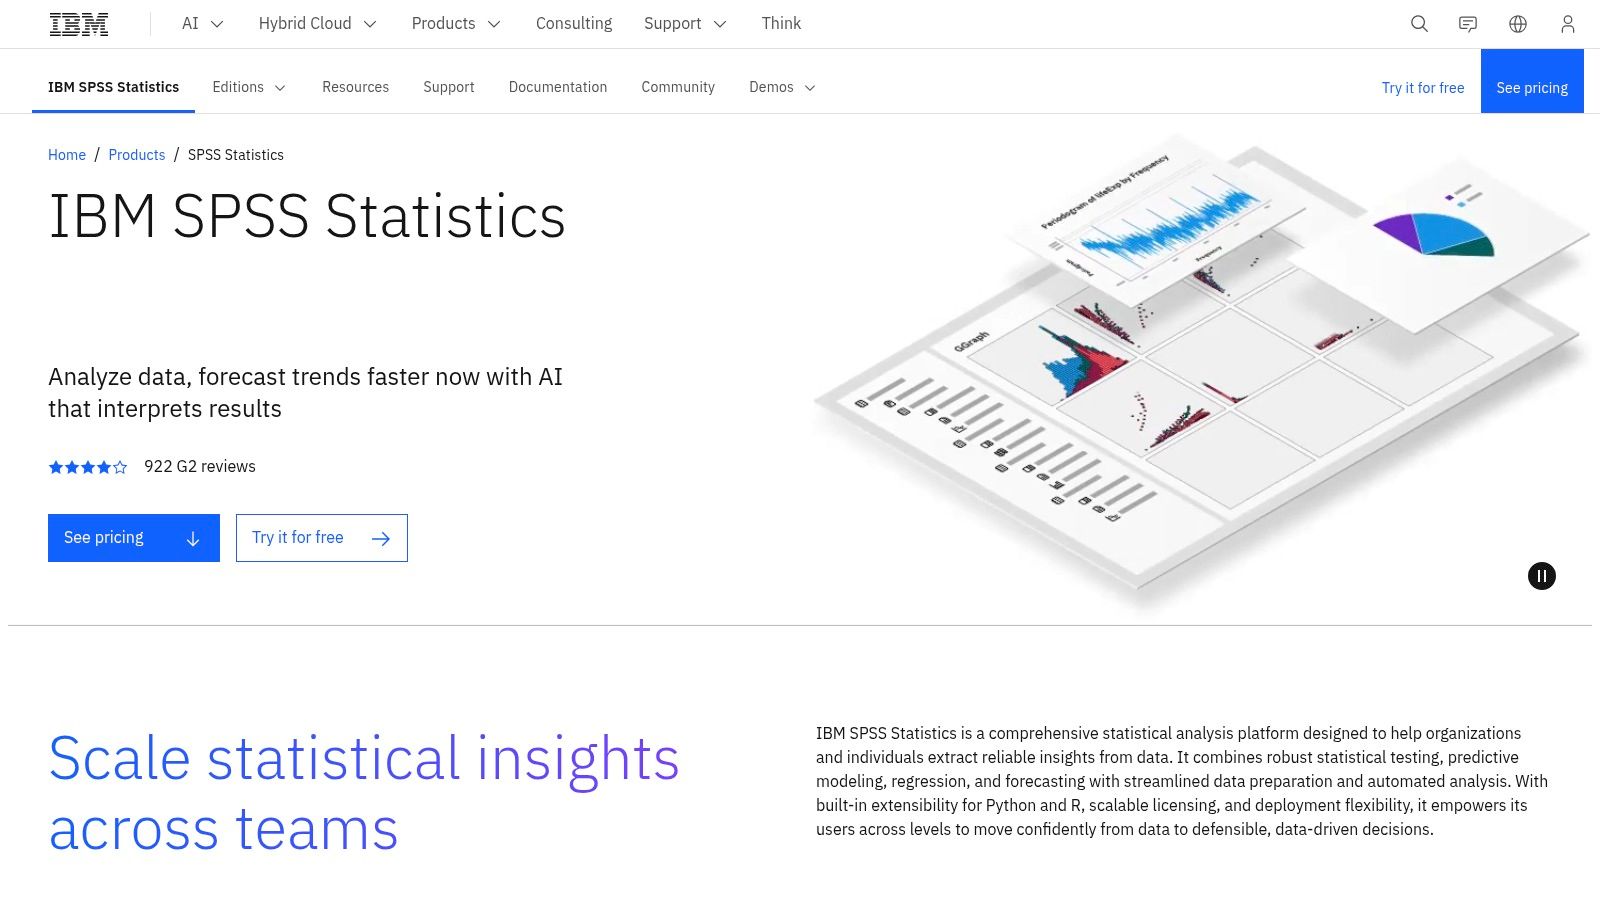
Unlike all-in-one survey platforms, SPSS is a specialized tool focused purely on the analysis phase. Its strength lies in its extensive library of statistical procedures and its extensibility with R and Python, allowing junior analysts to automate repetitive tasks or run custom models. This focus makes it one of the most powerful market research data analysis tools for teams working with complex survey data or secondary datasets that demand rigorous statistical validation. The local installation also ensures complete control over sensitive data, a key requirement for many enterprise research projects.
Key Features and Use Cases
- Ideal Use Case: Analysts conducting customer segmentation using cluster analysis, building predictive models for consumer behavior, or performing advanced statistical tests on survey results.
- Licensing and Deployment: Offers flexible licensing with both subscription and perpetual options. It runs locally on your machine, which is ideal for maintaining control over sensitive or proprietary data.
- Extensibility: Integrates with open-source languages like R and Python, allowing analysts to extend its core functionality with custom scripts and advanced modeling techniques.
| Pros | Cons |
|---|---|
| Trusted by research teams for decades with strong documentation | Steeper learning curve than point-and-click survey tools |
| Local installation supports sensitive-data control | Add-on modules for advanced features can increase the total cost |
| Comprehensive suite of statistical tests and procedures | Interface can feel dated compared to modern BI platforms |
Website: https://www.ibm.com/products/spss-statistics
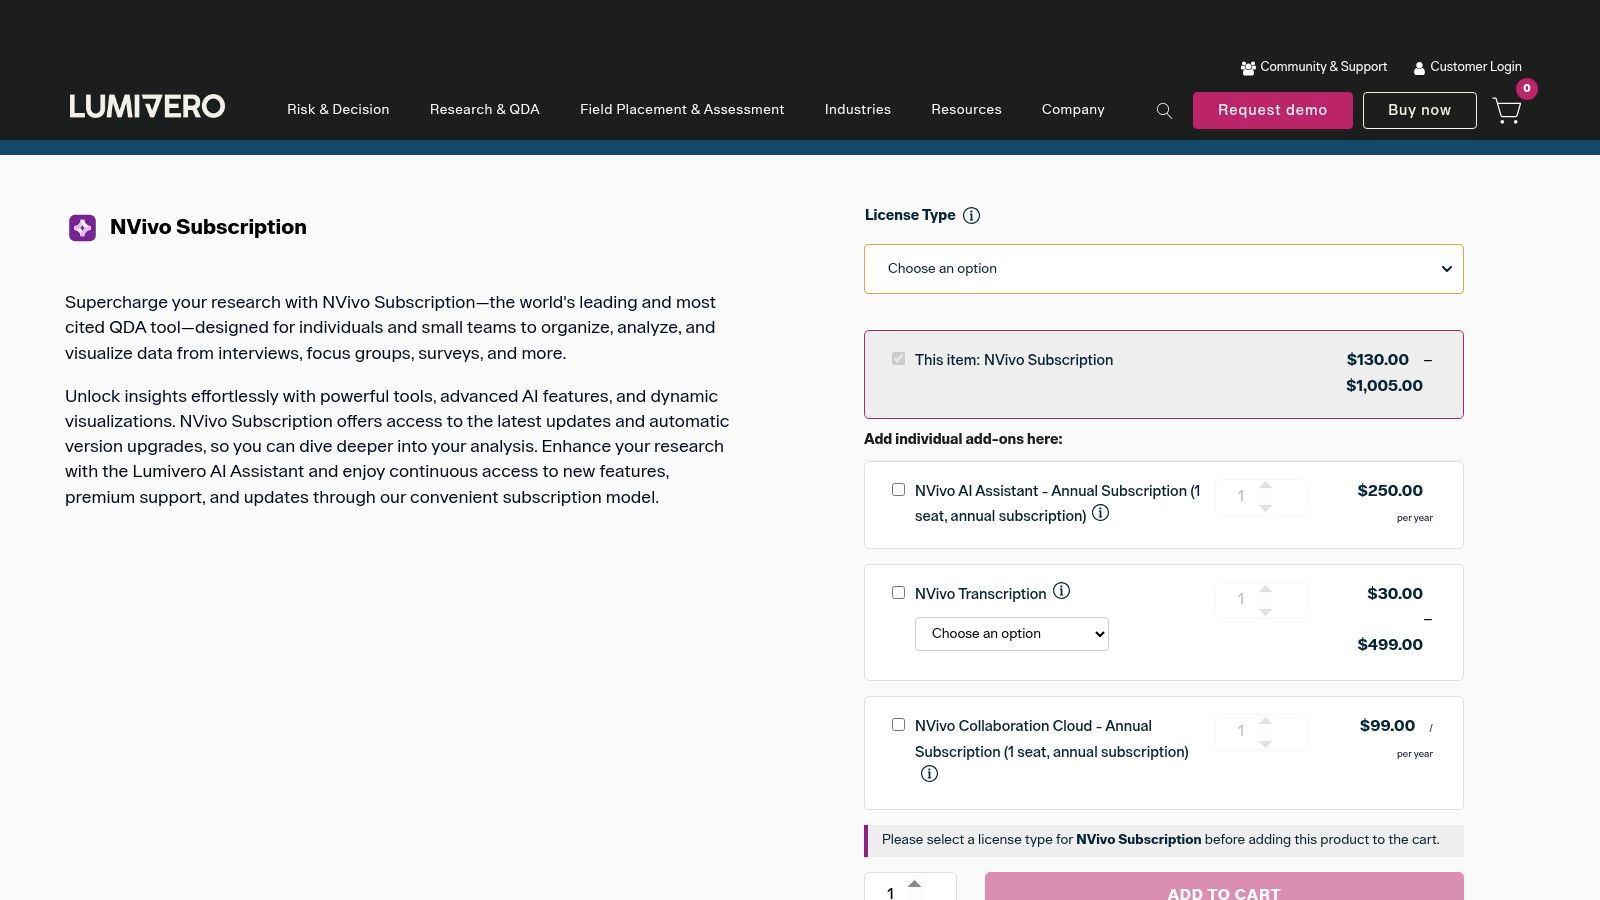
8. NVivo (Lumivero)
NVivo is the gold standard for deep qualitative and mixed-methods data analysis. When your research moves beyond numbers and into the rich, unstructured world of interview transcripts, focus group notes, social media comments, or open-ended survey responses, NVivo provides the framework to uncover meaningful themes and patterns. It allows researchers to systematically code, classify, and visualize unstructured text, video, and audio data, transforming qualitative chaos into structured, defensible insights.
Unlike quantitative tools that focus on statistical significance, NVivo excels at managing interpretive analysis, helping you build a case for your conclusions with clear evidence. This makes it an indispensable part of the toolkit for anyone doing thematic analysis, sentiment analysis, or discourse analysis. As one of the most robust qualitative market research data analysis tools, it empowers analysts to rigorously explore the "why" behind customer behavior, not just the "what." Optional add-ons like its AI Assistant can help accelerate theme discovery and summarization.
Key Features and Use Cases
- Ideal Use Case: Market researchers analyzing in-depth interview transcripts, academics conducting literature reviews, or insights analysts coding thousands of open-ended survey responses to identify core customer pain points.
- Self-Serve vs. Enterprise: Available for individual purchase with clear pricing for students, academics, and commercial users. Enterprise and multi-user licenses are also available.
- Mixed-Methods Capability: Allows researchers to import and cross-reference quantitative data (like survey demographics) with qualitative codes, enabling sophisticated segment-based analysis.
| Pros | Cons |
|---|---|
| The industry standard for rigorous qualitative data analysis | Primarily focused on qual data; not a replacement for statistical software |
| Collaboration Cloud add-on facilitates teamwork on complex projects | Add-on costs for Transcription and AI can increase the total investment |
| Handles a wide variety of unstructured data types, including text and audio | The interface has a learning curve for those new to qualitative analysis |
Website: https://lumivero.com/product/nvivo-14/
9. Tableau (Tableau Cloud/Server)
Tableau is a premier visual analytics platform that excels at transforming raw market research data into interactive, shareable dashboards. While not a data collection tool itself, it serves as the powerful final step for analysis, allowing researchers to connect to survey exports, databases, and spreadsheets to explore findings visually. Its drag-and-drop interface empowers users to slice, dice, and filter complex datasets on the fly, uncovering trends that are often missed in static reports or crosstabs.
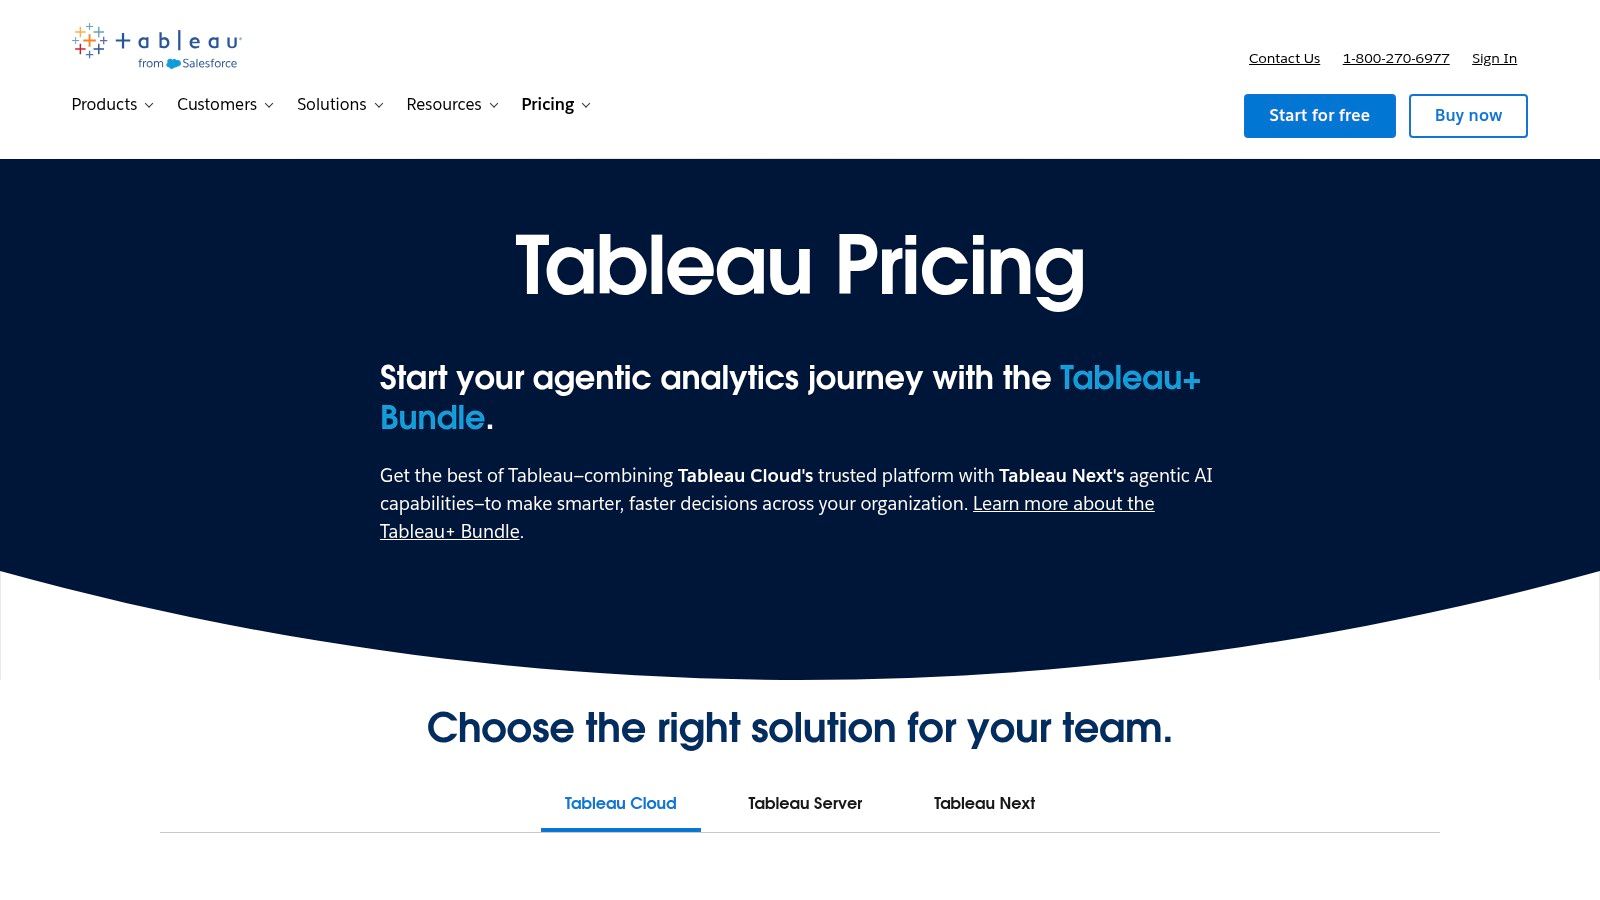
Unlike platforms with built-in basic charting, Tableau is purpose-built for deep visual exploration and data storytelling. It stands out as one of the best market research data analysis tools for teams that need to present findings to stakeholders in a compelling, interactive format. Its strength lies in handling large, structured datasets, but this also means that survey data often needs reshaping first. This preprocessing is a critical step, aligning with core principles of data cleaning best practices to ensure analytical accuracy.
Key Features and Use Cases
- Ideal Use Case: Market research analysts visualizing large-scale survey results, tracking brand sentiment over time, or creating interactive dashboards for executive presentations.
- Self-Serve vs. Enterprise: Offers both cloud and on-premise (Server) deployments. Licensing is tiered by user role (Creator, Explorer, Viewer), requiring careful planning for team-wide access.
- Data Preparation: Includes Tableau Prep, a dedicated tool for cleaning, pivoting, and modeling data from various sources before it is brought into the main platform for visualization.
| Pros | Cons |
|---|---|
| Best-in-class interactivity and visualization quality | Requires clean, modeled data; survey reshaping may be needed |
| Large user community and extensive learning resources | Viewer/Explorer/Creator licensing can be complex to plan |
| Connects to a vast range of data sources simultaneously | Can be overkill for simple, one-off charting needs |
Website: https://www.tableau.com/pricing
10. Microsoft Power BI — Scalable Data Visualization
Microsoft Power BI is a business analytics service that empowers market researchers to transform raw data into rich, interactive visualizations. As part of the broader Microsoft Fabric and Power Platform ecosystem, it excels at connecting to disparate data sources, modeling complex survey results, and building shareable dashboards. For analysts already operating within a Microsoft 365 or Azure environment, Power BI offers a familiar and cost-effective entry point into enterprise-grade business intelligence, making it one of the most widely adopted market research data analysis tools.
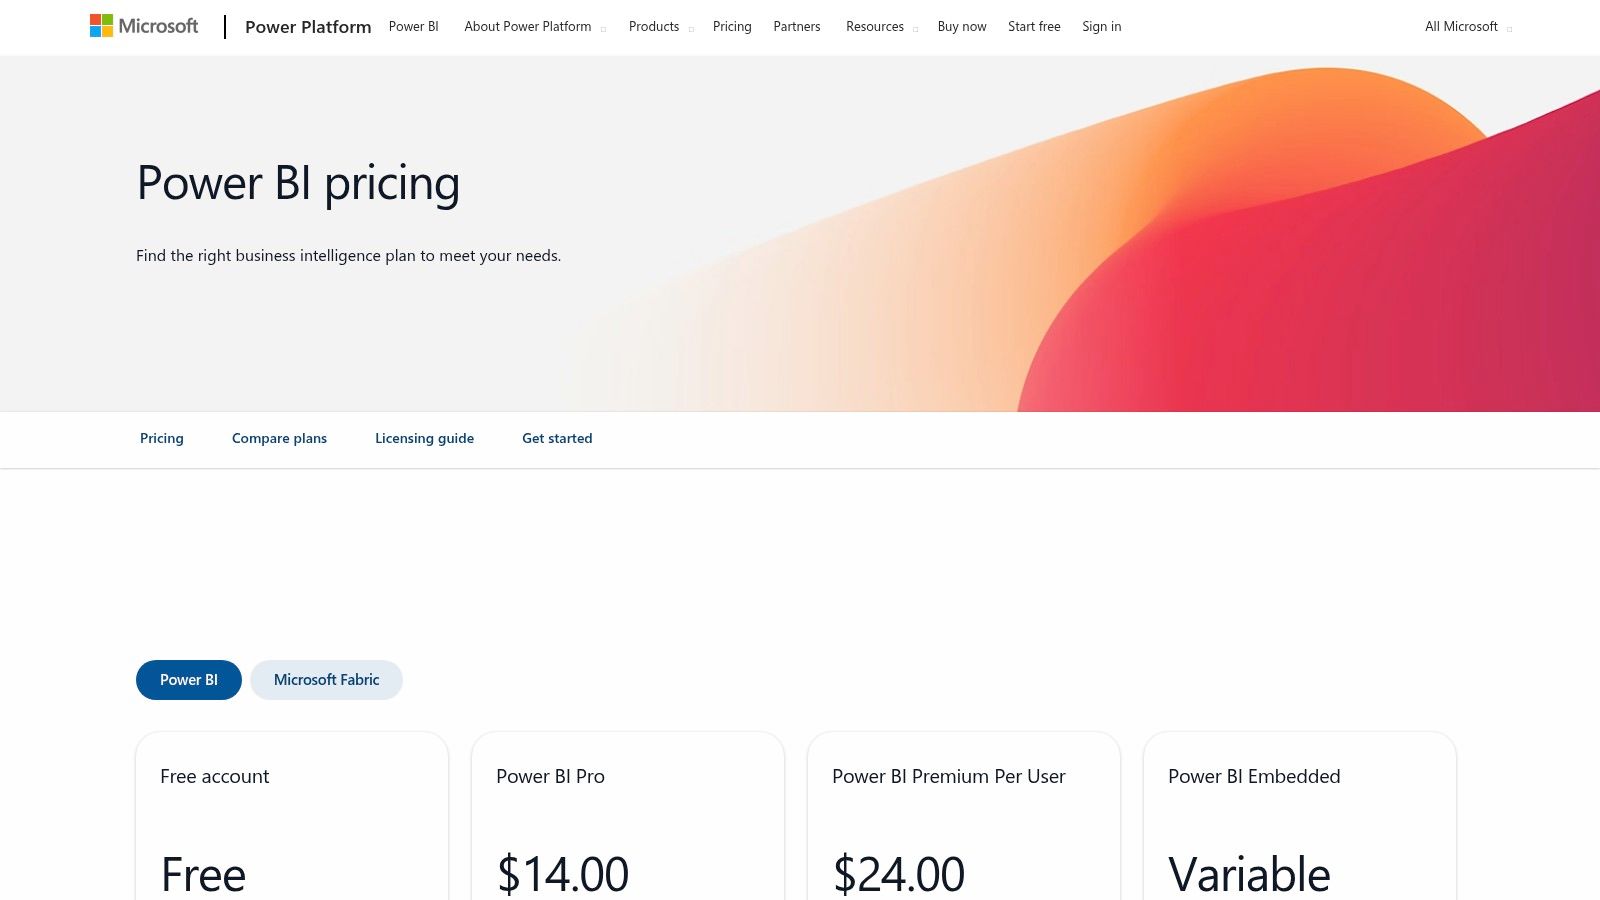
Its strength lies in its ability to handle massive datasets and perform complex modeling that goes far beyond standard spreadsheet analysis. While it requires an upfront effort to structure and model survey data correctly, the payoff is a dynamic reporting environment where stakeholders can self-serve insights. AI-driven features in premium versions further enhance its capability, allowing analysts to uncover hidden patterns and trends in market data with greater speed and accuracy.
Key Features and Use Cases
- Ideal Use Case: Data analysts and market research teams inside organizations with a significant Microsoft footprint who need to consolidate, model, and visualize large-scale survey data, competitor analysis, and market trends in interactive dashboards.
- Self-Serve vs. Enterprise: Offers a free desktop version for individual use, with Pro and Premium Per User licenses for collaboration. Enterprise-scale sharing and governance are managed through Premium capacity (P-SKU) licensing.
- Ecosystem Integration: Natively connects to hundreds of data sources, including Excel, SQL Server, and Azure, providing a centralized hub for all market research analytics.
| Pros | Cons |
|---|---|
| Low per-user entry price and robust ecosystem | Data modeling is required for complex survey structures |
| Flexible sharing options via Premium capacity when needed | Capacity planning for very large deployments can be complex |
| AI features and large model support (Premium) | The learning curve can be steep for non-technical users |
Website: https://www.microsoft.com/en-us/power-platform/products/power-bi/pricing
11. Similarweb — Digital Competitive Intelligence
Similarweb is a go-to platform for digital market intelligence, offering powerful insights into website and app performance. For analysts tasked with understanding a company's digital footprint, it provides estimated traffic data, audience demographics, engagement metrics, and channel breakdowns. This allows for rapid benchmarking against competitors to understand market share, identify traffic sources, and analyze online marketing strategies.
Unlike internal analytics tools that only show your own data, Similarweb provides an external, comparative view of the entire digital landscape. This makes it an indispensable tool for sizing digital markets, uncovering competitor channel strategies, and identifying emerging players. The platform excels at translating raw web data into actionable business intelligence, making it a critical asset among market research data analysis tools for anyone focused on the digital economy.
Key Features and Use Cases
- Ideal Use Case: Market researchers, competitive intelligence analysts, and marketing strategists benchmarking website traffic, analyzing marketing channel effectiveness, or tracking share-of-voice online.
- Self-Serve vs. Enterprise: Offers several self-serve packages for individuals and small teams, while enterprise plans unlock deeper historical data, API access, and more advanced datasets.
- Actionable Dashboards: Provides clean, presentation-ready visualizations that make it easy to compare key performance indicators like monthly visits, bounce rates, and traffic sources across multiple domains.
| Pros | Cons |
|---|---|
| Actionable, presentation-ready competitive KPIs | Self-serve tiers limit historical depth and the number of users |
| Strong self-serve packages plus enterprise options | Highest-value datasets and APIs require custom quotes |
| Excellent for analyzing digital marketing channel mix | Data is based on estimates and should be used directionally |
Website: https://www.similarweb.com/packages
12. Brandwatch Consumer Research
Brandwatch Consumer Research is a premier social and consumer intelligence platform designed for deep, qualitative analysis at a quantitative scale. It taps into a massive archive of over 1.2 trillion historical online conversations from social media, forums, reviews, and news sites, adding half a billion new posts daily. For researchers aiming to understand organic consumer sentiment and emerging trends, Brandwatch provides the raw data and AI-powered tools to extract meaningful signals from unstructured public conversations.
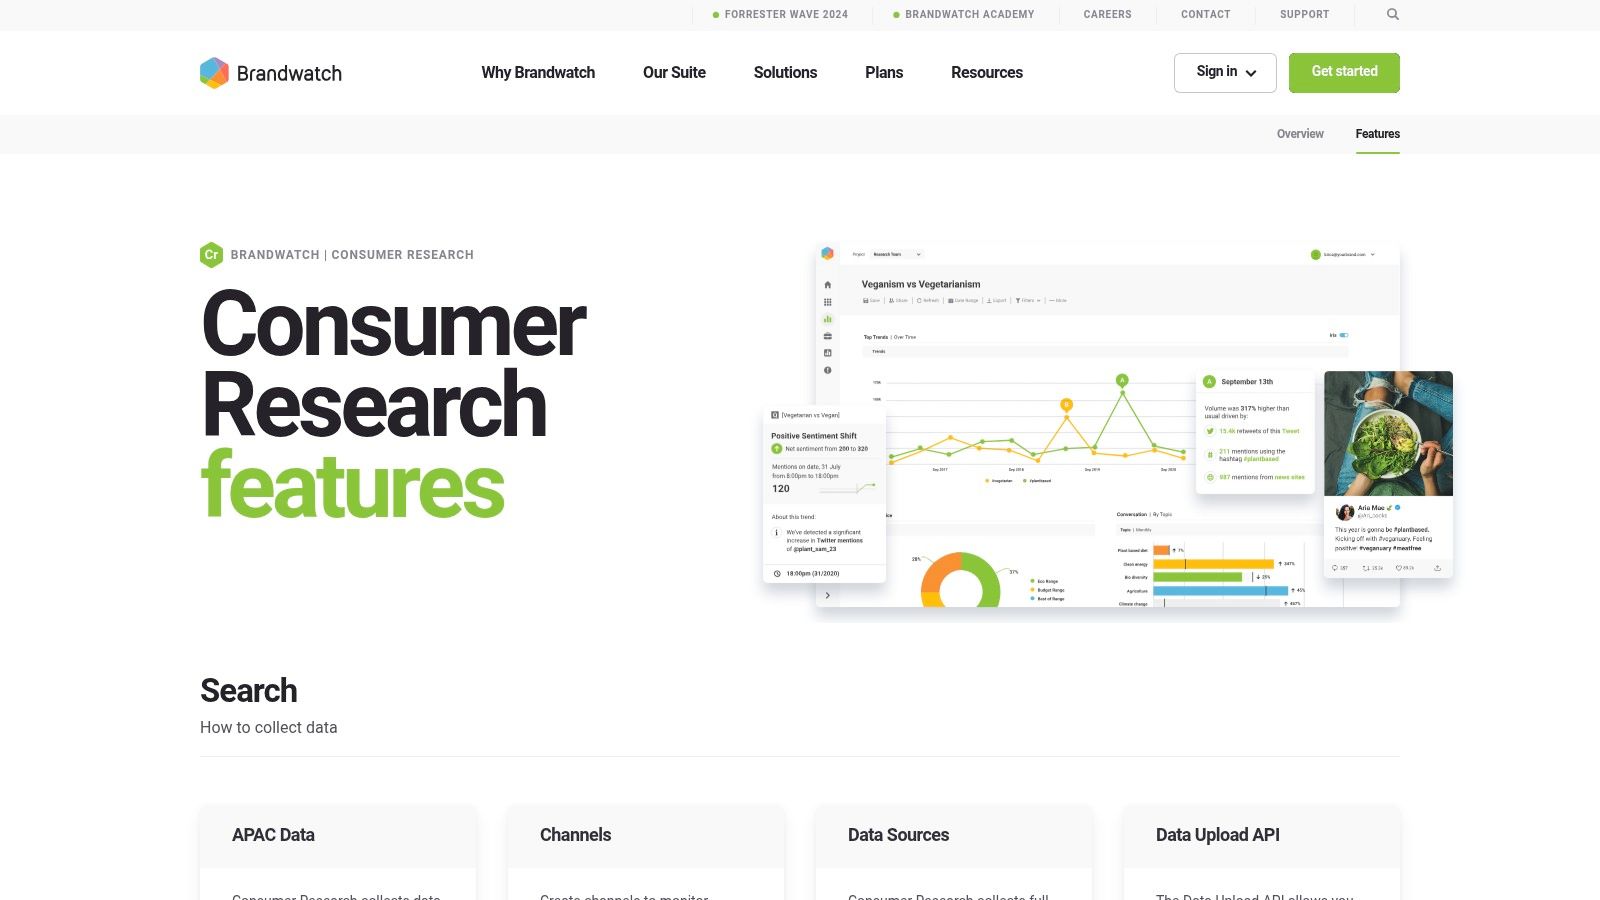
What sets Brandwatch apart is its analytical depth, moving beyond simple keyword mentions. Its AI assistants and custom machine learning classifiers can analyze sentiment, topics, entities, and even imagery, allowing analysts to uncover nuanced insights that traditional surveys might miss. The ability to upload proprietary data, like survey responses via its API, and analyze it alongside social data makes it one of the most versatile market research data analysis tools for creating a unified view of consumer voice. This is crucial for tracking brand health, identifying category white space, or validating product concepts with real-world feedback.
Key Features and Use Cases
- Ideal Use Case: Market researchers and brand strategists conducting brand perception studies, competitive intelligence analysis, or identifying unmet consumer needs by analyzing public online conversations at scale.
- Self-Serve vs. Enterprise: This is a purely enterprise-focused platform. Access and pricing are available exclusively through engagement with their sales team, tailored to specific data and feature requirements.
- Advanced Querying: Success requires mastering its powerful Boolean query language to filter out noise and achieve research-grade precision, a critical skill for junior analysts to develop for effective use.
| Pros | Cons |
|---|---|
| Unparalleled depth of data sources and historical coverage | Enterprise-only pricing requires significant budget allocation |
| Powerful AI for sentiment, topic, and image analysis | Demands careful and precise query setup to ensure data accuracy |
| Strong alerting, dashboards, and export options | The platform's complexity can present a steep learning curve |
Website: https://www.brandwatch.com/products/consumer-research/features/
12 Market Research Data Analysis Tools — Comparison
| Product | Core features & USPs (✨) | UX / Quality (★) | Value & Pricing (💰) | Target audience (👥) |
|---|---|---|---|---|
| 🏆 Row Sherpa | ✨ Batch CSV prompting, validated JSON/CSV outputs, optional live web enrichment, public API | ★★★★☆ Predictable, fast async jobs; production-friendly | 💰 Free → Pro ($0–$449/mo) usage-based rows/web-search/token limits | 👥 Junior analysts, sales ops, VC analysts, market researchers |
| Qualtrics — Strategic Research | ✨ Enterprise survey design, panel mgmt, governance, integrations | ★★★★☆ Enterprise-grade reliability & controls | 💰 Free Surveys tier → enterprise pricing (sales) | 👥 Enterprise insights teams, CX/EX groups |
| SurveyMonkey (Momentive) | ✨ Easy survey builder, collaboration, built-in analytics | ★★★★☆ Fast time-to-value; many templates | 💰 Free→paid; per-response overages on some plans | 👥 Junior analysts, marketing & research teams |
| Alchemer (SurveyGizmo) | ✨ Strong logic/piping, flexible reporting, Business API | ★★★☆☆ Flexible UI; helpful support | 💰 Clear USD plans; API on Business tier | 👥 Small research teams, SMBs needing control |
| Displayr — Analysis & Reporting | ✨ Automated reproducible reporting, stats, dashboards, AI | ★★★★☆ Powerful export & automation; premium feel | 💰 Annual professional pricing; AI/server add-ons | 👥 Insights teams standardizing workflows |
| Crunch.io | ✨ Sub-second crosstabs, weighting, tracker-friendly, R support | ★★★★☆ Very fast for large tracker datasets | 💰 Pricing via sales / quote | 👥 Tracker studies, agencies, data-focused researchers |
| IBM SPSS Statistics | ✨ Advanced statistical modeling; R/Python extensibility; local install | ★★★★☆ Robust & defensible; steeper learning curve | 💰 Subscription or perpetual; add-ons increase cost | 👥 Quantitative researchers, statisticians |
| NVivo (Lumivero) | ✨ Qual coding, queries, visualizations, AI-assisted summaries | ★★★★☆ Gold-standard for qualitative analysis | 💰 License-based; add-on costs (AI/transcription) | 👥 Qual researchers, academics, mixed-methods teams |
| Tableau (Cloud/Server) | ✨ Visual analytics, storytelling dashboards, AI features | ★★★★★ Best-in-class interactivity & community | 💰 Creator/Explorer/Viewer tiers; mid→enterprise pricing | 👥 Data analysts, BI teams, visualization leads |
| Microsoft Power BI | ✨ Modeling, MS35/Azure integration, AI & large-model support | ★★★★☆ Cost-effective with strong ecosystem | 💰 Low per-user entry; Premium capacity for scale | 👥 Org-wide analysts, Microsoft shops |
| Similarweb | ✨ Web/app traffic, audience insights, channel benchmarks | ★★★☆☆ Actionable competitive KPIs | 💰 Self-serve packages → enterprise quotes for deeper data | 👥 Market/competitive analysts, growth teams |
| Brandwatch Consumer Research | ✨ Massive social archive, Gen-AI assistant, image & topic analysis | ★★★★☆ Deep social signals; rich dashboards | 💰 Enterprise pricing (sales only) | 👥 Social researchers, brand & comms teams |
Choosing Your Next Tool: It’s About Workflow, Not Just Features
We've explored a broad landscape of market research data analysis tools, from enterprise survey platforms like Qualtrics to powerful BI dashboards in Tableau. Each tool is built for a different stage of the research lifecycle, but the key isn't to memorize feature lists. It's to understand which tool fits the reality of your day-to-day work.
For junior analysts, demand-gen specialists, and VC analysts, the pressure to deliver accurate insights quickly is intense. Your time is your most valuable asset, yet it's often consumed by the manual, repetitive tasks that come before the actual analysis even starts. The real opportunity to level up is to automate that grind. So instead of asking which tool has the most features, the better question is: "Which tool solves my biggest bottleneck?"
From Raw Data to Actionable Insight: A Practical Framework
Finding the right tool starts with an honest look at your current process. The goal isn't to replace your entire stack but to add something that smooths out the friction points. Where does your workflow slow down? Is it manually standardizing industry classifications across a list of 10,000 companies? Is it enriching CRM contacts with firmographic data from multiple sources? Or is it struggling to apply a consistent sentiment analysis model to thousands of open-ended survey responses?
These aren't small problems; they are the foundational tasks that all strategic analysis is built on. An error in data cleaning or a missed enrichment opportunity can compromise your entire project. This is where modern, AI-driven solutions like Row Sherpa shine—they focus on the high-volume, structured data processing that traditional platforms often handle clumsily or not at all. While a tool like Brandwatch excels at broad social listening, it won't help you clean and categorize the CSV export you get from it. Similarly, while SPSS is a powerhouse for statistical modeling, it assumes your data is already pristine.
Key Considerations for Your Next Tool Adoption
As you evaluate potential additions to your toolkit, look past the marketing slogans and focus on these practical factors:
- Integration vs. Disruption: Does the tool fit into your existing workflow, or does it force you to build a new one around it? Tools that work with simple, universal formats like CSVs offer the most flexibility, letting you plug them in exactly where needed without complex API integrations or engineering support.
- Scalability and Predictability: Can the tool handle the volume you need today and the volume you’ll have tomorrow? More importantly, does it produce predictable, structured outputs you can rely on? For tasks like taxonomy extraction or data normalization, consistency is everything.
- Time-to-Value: How fast can you get up and running? A powerful tool with a steep learning curve might not solve your immediate needs if it takes months to master. Prioritize solutions with intuitive interfaces that let you get work done in minutes, not weeks.
- Focus on Augmentation, Not Replacement: The most effective tools augment your skills, freeing you from manual labor so you can focus on higher-level strategic thinking. Look for solutions that act as a force multiplier for your expertise, handling the repetitive work so you can focus on interpretation, narrative-building, and presenting insights that drive decisions.
Ultimately, your goal is to build a nimble, efficient workflow that turns raw data into strategic intelligence with minimal friction. By thoughtfully selecting tools that automate the most laborious parts of your process, you reclaim your time and elevate your role from a data processor to a strategic analyst.
Tired of spending hours on manual data cleaning and enrichment in spreadsheets? Row Sherpa is built specifically to automate the high-volume, repetitive data tasks that slow down market research and analysis. Transform your messy CSVs into analysis-ready datasets in minutes by visiting Row Sherpa to see how you can streamline your workflow today.